Oscillatory Zoning in Minerals
In
most petrographic studies zoning is invariably described qualitatively in terms
of its optical character, this often reflects the distribution of some property
or feature of interest such as refractive index or cathodoluminescence; such
optical characteristics are determined by the mineral chemistry and or
structure. In order to understand the
significance of oscillatory zoning patterns (OZP) it is important that we
develop a quantitative means of describing the patterns as well as a means of
linking the chemical and structural information to the optical features. In this way we will be able to (1) compare
zoning patterns in natural minerals and (2) compare natural patterns with the
products of numerical models. This work
is needed to set out the framework for considering minerals as dynamical
systems. I have shown, using image and
numerical analysis, that it is possible to determine Lyapounov exponents and
fractal dimensions for trace‑element oscillatory zoning in minerals. In cases where the exponents are negative
this shows that the patterns are chaotic which is a strong indication that the
chemical variation is the product of local self-organized processes and
chemical feedback operating at the growth interface of the mineral with its
environment. This is distinct from
larger-scale changes in the bulk composition of the system.
This
initial work was done on accessory minerals from igneous rocks. Auto correlation and fractal analysis has
also been applied to trace element zoning and optical zoning in agate and
calcite from surficial environments. Here the objective was to assess the
distribution of Fe, Zn and Sr in two different minerals from different
environments. Using spectral analysis,
Sr and Zn in agate showed the same periodicity whereas Fe had a much
larger periodic component possibly indicating that Sr and Zn substituted in the
2+ oxidation state and Fe oscillated between the Fe2+ and Fe 3+ states. The measured
A chaotic system is very sensitive to initial conditions. One set of initial conditions may give rise to a pattern very different from a set of initial conditions that is only slightly different. (Rather than interpreting radically different geological histories and therefore different equations there may be one system and set of governing equations and only slightly different starting conditions). The rate at which two trajectories diverge from only slightly different initial conditions is described by the Lyapounov exponent. This is a measure of chaos.
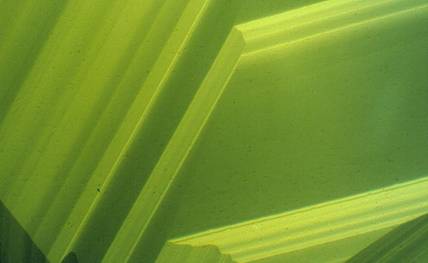
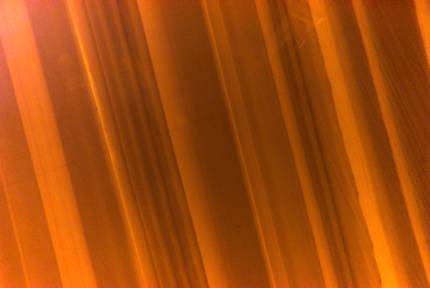
Zircon
These images shows oscillatory zoning in a zircon from
Calcite Modeled Pattern

Bryksina, N.A.,
Bryksina, N.A.
and
Bryxina, N.A.,
Bryxina, N.A., Sheplev V.S., Ripinen, O.I., Halden, N.M., Campbell J.L., and Teesdale W.J. (2000) Qualitative analyses of dynamic model of Wang-Merino and quantitative estimates of trace elements distributions in sample from Arc-Bogdo (Mongolia). Geology and Geophysics, N 9, p. 1287-1297 (in Russian)
Bryxina, N. A.,
Dublyansky, Yu. V., Halden, N.M.,
Bryxina, N.A.,
Ripinen, O. I.,
Halden, .N.M.,